It's getting to be that time of year again, and the excitement is
starting to build. The time spent preparing for the draft in your
respective league(s) should now be starting to rival (or even exceed)
your SportsCenter viewing - at least if you want to win.
Leading up to the draft, each person has their own way to prepare.
Some pick up Charpentier's and follow his advice, just kind of winging
it for when to select different player positions. Others use the
pre-compiled cheat sheets and draft tools from the myriad of magazines
and/or web sites available (FFToday's own Cheatsheet
Compiler & Draft Buddy are excellent choices, by the way).
Still others build spreadsheets and use them to guide their drafting
strategy. Whatever works for you is fine, but there is a best way
to approach the draft.
Last year's draft will serve as the foundation for this discussion.
I'll look at the good picks, bad picks, and missed picks. I'll
look at how to predict the overall nature of the draft, and how
that can be useful when determining which player to pick and when.
I'll also look at the successes and failures from last year and
see how to identify similar situations this year. By analyzing
last year's draft, you'll learn how to improve this year's draft
and avoid making the same mistakes.
Some Background Info
The analysis here can be applied to any league structure, but
I'll use the results from a league I'm in to guide this discussion.
A quick summary of the league rules:
twelve teams
thirteen roster spots
basic scoring with tiered performance bonuses
start 1 QB, 1 or 2 RB, 3 or 4 WR/TE, 1 PK
There are two main pieces of data from last year that I'll use for
this analysis: the draft, and player fantasy scoring.
I'm going to predicate all of the following discussion on fantasy
scoring as filtered through a standard value-prioritized ranking
(VPR) system. The overall rankings generated with the VPR are different
from a simple decreasing sort of the scores. This is because players
are ranked by their relative worth rather than by the number of
points they score. This is a method that quantifies a lot of the
intuitive heuristics used for drafting: wait until the end of the
draft to pick a kicker; grab a stud running back; wait a while to
take a quarterback.
First, let's see how the ranked list is generated from last season's
final overall rankings.
Initially, each position is considered individually. Let's look
at QBs as an example. All of the QBs are ranked according to the
number of points scored last year. Then, I subtract the points
scored by the 12th ranked QB from every score. This gives a relative
worth for QBs based on the "starters" for each team.
Finally, I add in the standard deviation among the scores for
the top 12 QBs. This adds in a measure of how quickly the talent
falls off for QBs: a small deviation indicates that most of the
QBs had nearly the same score; a large deviation indicates that
there were only a few QBs who scored well. In the first case,
the choice of QB isn't as important because there are several
similarly ranked players. In the second case, QBs are more important
as there is a premium on the top ranked players. This then gives
an ordered list of QBs that has an overall value embedded within
it.
I apply the same method to each position, the sole exception
being that WR and TE are considered simultaneously. That's because
there's no difference between the two positions in the scoring
system under consideration. For each position, the value of the
worst starter is subtracted (e.g., 18 for RB, 42 for WR/TE). Now,
all of the positions can be compared. The result is an ordered
list that takes into account the importance of each position in
this scoring system.
How can this method be extrapolated for use in predicting scoring
for the coming year? Extending the method to guide this year's
draft selections relies upon less concrete data than the previous
year's statistics. There is, obviously, a certain degree of uncertainty
involved in predicting how well each player will do this year.
There is a method for this prediction as well.
Now I'm not going to give away all of my secrets, but I'll at
least outline the method for you. I predict the statistics for
each player and then calculate fantasy points from those statistics
(you can use publicly available
projections instead, if you wish). Additional considerations
are the percentage of a team's offense (for each position) that
player scored the past year and intangibles for the coming season
for both the player and the team for which he plays. These are
combined with the raw prediction to get a more 'accurate' value
for the coming year. Granted, this isn't an exact science, but
it does permit the generation of a draft list that is based on
the relative worth of each player, regardless of position.
Now with all of that said, let's move on to the analysis of last
year's draft.
Summary of Last Year's Draft
The table below shows the distribution of players taken in each
round of the draft, by position. Pretty much everyone bought into
the "grab a stud RB" heuristic, as there were 22 RBs
taken in the first three rounds. After that, the run on receivers
started, with 58% of all picks in rounds three through seven being
receivers. For QBs, a few were picked each round after the first,
with everyone finally getting their starter by the end of the
seventh round.
Players Taken per Round,
By Position
Pos
1
2
3
4
5
6
7
8
9
10
11
12
13
Tot
QB
0
2
2
2
2
1
4
3
2
3
1
0
2
24
RB
9
10
3
1
2
4
2
5
3
3
4
0
6
52
WR
3
0
7
8
8
6
6
4
5
2
4
5
3
61
TE
0
0
0
1
0
1
0
0
0
2
0
0
0
4
PK
0
0
0
0
0
0
0
0
2
2
3
7
1
15
If the distribution of players taken by position in this table is
compared with the number of players at each position that shows
up in the VPR listing of last year's stats, there are some interesting
differences. In that listing the break-down was:
QB - 12
RB - 29
WR - 77
TE - 18
PK - 20
If somehow the guys in my league were prescient enough to know
how the season would play out, they could have used these distributions
as guidelines for drafting players. In that case, half as many QBs
would be drafted, twenty three fewer RBs would be picked, sixteen
more WRs would be picked, fourteen additional TEs would be picked,
and five additional PKs would be picked. Some of this is actually
intuitive given the rules of this particular league, as the league
includes more WRs/TEs than RBs in the starting lineup (either 4:1
or 3:2, depending), and therefore there are more WRs who can score.
In this league, there's a lot more value in loading up on WRs and
TEs than RBs.
More Details About Draft Predictions
The previous comments aside, in order to do well in the draft
it pays to be able to predict how it will develop. No one can
really stick by the exact breakdown of players in the VPR listing
discussed above as they've got rosters to fill and contingencies
(e.g., bye weeks, handcuffing) for which to plan.
By examining the number of players taken by position (as above)
for each of the past three years, we can project how many players
will be taken by position in this year's draft. The table below
shows these numbers. Nothing fancy here, just simple averaging.
It works, too.
Number of Players Drafted
by Position per Year
Pos
2001
2002
2003
2004
QB
22
21
24
22
RB
50
48
52
50
WR
61
61
61
61
TE
6
7
4
6
PK
17
19
15
17
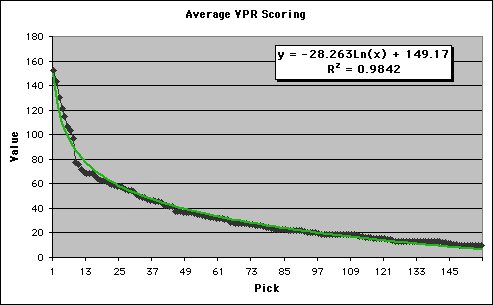
Taking this breakdown of players and then averaging the VPR values
for the corresponding number of players at each position, we can
arrive at an average VPR ranked draft. The figure below shows this
draft. Interestingly enough, the resulting graph of draft value
vs. draft number is a straightforward logarithmic curve. This correlation
can be used to predict the value for each pick in this year's draft.
Such a correlation is especially useful for judging whether to trade
draft picks and such.
Of course, you can only do this kind of analysis if you have access
to the last couple of years of data for your league. But if you
do, it's quite helpful. Don't be afraid to ask your commissioner
for the data; odds are that they've got it squirreled away somewhere.
If everyone were to redo last year's draft using the VPR listing
of players' final stats, picking the best player with each pick,
this curve would be reproduced. This is actually good practice to
revisit the draft and figure out which picks should have been made
and when. Practice makes perfect, and all that.
Now that I've covered the generalities of draft analysis, the next
thing to look at are some specifics. In Part
2 of this article, I'll look at specific examples from last
year's draft.